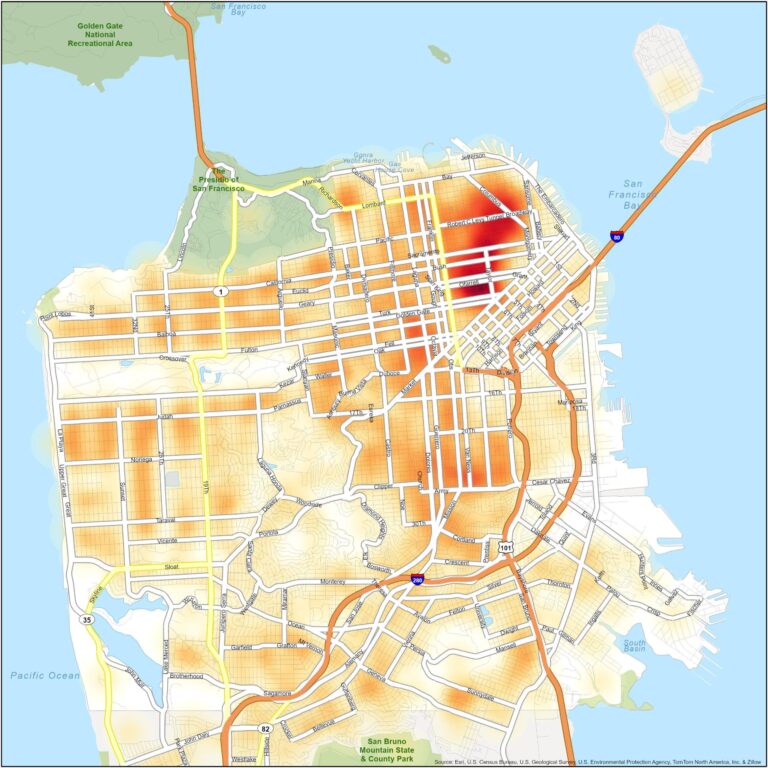
Analyzing San FranciscoŌĆÖs Distinct Crime Dynamics in Comparison to Other California Cities
Contrasting Crime Patterns Across CaliforniaŌĆÖs Urban Centers
San FranciscoŌĆÖs crime profile diverges notably from other major Californian cities, shaped by its unique urban density, socioeconomic diversity, and vibrant tourism sector. While the city experiences elevated rates of property crimes such as vehicle break-ins and petty theft, it reports comparatively lower levels of violent offenses like aggravated assault and robbery than cities like Los Angeles or Oakland. This pattern reflects San FranciscoŌĆÖs concentrated population and the influx of visitors, which create hotspots for opportunistic crimes but also attract heightened law enforcement presence in key areas.
The table below highlights recent crime statistics per 100,000 residents, illustrating how San Francisco compares with other large cities in the state:
| City | Burglary | Aggravated Assault | Vehicle Break-ins | Gang-Related Violence |
|---|---|---|---|---|
| San Francisco | 1,200 | 350 | 1,800 | 150 |
| Los Angeles | 1,100 | 650 | 900 | 600 |
| San Diego | 850 | 300 | 700 | 90 |
| Sacramento | 1,000 | 400 | 850 | 200 |
Underlying Causes Behind San FranciscoŌĆÖs Crime Characteristics
The cityŌĆÖs social fabric and geographic layout heavily influence its crime trends. San FranciscoŌĆÖs compact urban environment, coupled with stark income disparities, fosters a complex crime ecosystem dominated by property offenses and drug-related issues. Neighborhoods such as the tech-centric SoMa contrast sharply with economically challenged areas like the Tenderloin, each exhibiting distinct crime profiles tied to local economic realities and demographic diversity. Persistent challenges like homelessness and substance dependency further complicate public safety efforts, distinguishing San Francisco from more suburban or rural locales.
The interplay between dense residential zones and tourist-heavy districts contributes to a surge in minor thefts and auto-related crimes, particularly near transit hubs and entertainment venues. The following table compares crime rates per 1,000 residents in San Francisco with those in Los Angeles and San Diego:
| Crime Category | San Francisco | Los Angeles | San Diego |
|---|---|---|---|
| Property Crime | 45 | 38 | 32 |
| Violent Crime | 7.5 | 9.7 | 4.3 |
| Drug-Related Offenses | 12 | 8 | 6 |
Additionally, San FranciscoŌĆÖs law enforcement and community engagement approaches differ significantly from other cities, influencing crime reporting rates and prevention effectiveness. These tailored strategies reflect the cityŌĆÖs intricate urban challenges and diverse population.
How Urban Density and Tourism Shape Crime in San Francisco
The combination of a densely packed population and a thriving tourism industry creates a distinctive crime environment in San Francisco. High concentrations of both residents and visitors in compact areas lead to increased occurrences of minor offenses such as pickpocketing, vehicle break-ins, and shoplifting, especially in well-known tourist destinations like FishermanŌĆÖs Wharf and Union Square. These neighborhoods often experience surges in non-violent crimes due to the transient nature of visitors and crowded public spaces. However, the cityŌĆÖs compactness also enables faster police response times and supports community-led crime prevention initiatives, setting it apart from more sprawling metropolitan areas.
While tourism injects significant economic benefits, it also places pressure on local infrastructure and social services, sometimes correlating with rises in public disturbances and drug-related incidents. Key contributing factors include:
- High pedestrian traffic attracting opportunistic offenders.
- Reduced anonymity in residential areas, making concealment of crimes more difficult.
- Resource allocation challenges as law enforcement balances attention between tourist zones and residential neighborhoods.
The table below compares crime rates and tourism volumes between San Francisco and Los Angeles, highlighting the interplay between visitor numbers and crime incidence:
| City | Property Crime (per 1,000 residents) | Violent Crime (per 1,000 residents) | Annual Tourist Visits (millions) |
|---|---|---|---|
| San Francisco | 65 | 12 | 25 |
| Los Angeles | 45 | 15 | 50 |
Innovative Approaches to Crime Reduction in San Francisco
San Francisco has pioneered community-oriented policing models aimed at fostering trust and collaboration between law enforcement and residents. Officers assigned to specific neighborhoods engage consistently with local communities, enabling early detection of crime trends and promoting cooperative prevention efforts. The city also leverages cutting-edge technology, including advanced surveillance and real-time analytics, to optimize resource deployment tailored to its unique urban and demographic landscape. This data-driven approach enhances the ability to predict crime hotspots and respond proactively.
Tackling the root causes of crime remains a cornerstone of San FranciscoŌĆÖs comprehensive safety strategy. Collaborative efforts with social service agencies focus on mental health support and housing assistance, addressing vulnerabilities that often contribute to criminal behavior. Key elements of this multifaceted approach include:
- Mental Health Crisis Intervention: Specialized units respond to incidents involving individuals with mental health challenges, reducing confrontations and unnecessary arrests.
- Homelessness Outreach: Partnerships between police and nonprofits aim to connect homeless individuals with shelter and support services rather than incarceration.
- Community Engagement: Regular neighborhood forums encourage residents to participate actively in identifying and solving local safety issues.
| Initiative | Focus Area | Measured Outcome |
|---|---|---|
| Community Policing Teams | Mission District, Tenderloin | 15% decrease in property crime rates |
| Mental Health Response Units | Citywide | 50% reduction in police transports to emergency rooms |
| Homeless Outreach Collaboration | SoMa, Civic Center | 30% increase in shelter placements |
Final Thoughts on San FranciscoŌĆÖs Crime Environment
In conclusion, San FranciscoŌĆÖs crime dynamics are shaped by a combination of its dense urban setting, diverse population, and economic disparities, setting it apart from other Californian cities. Understanding these unique factors is crucial for policymakers, law enforcement, and community members as they work together to develop effective, customized strategies to enhance public safety. Continued innovation and collaboration will be essential to addressing the cityŌĆÖs evolving challenges and fostering a safer environment for all residents and visitors.


